


 Platform Overview
The operational risk control data network
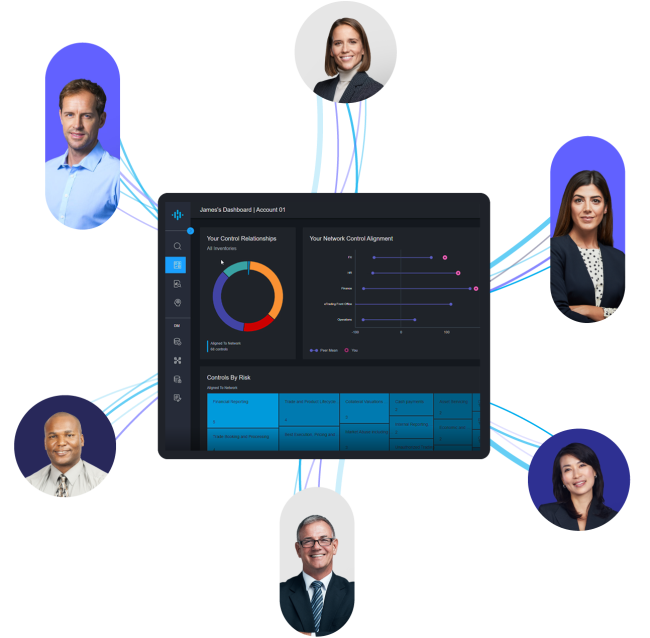
Access Acin’s AI powered OpRisk Data Quality Assessment service for firm-wide data quality analysis, and also our risk control network for completeness versus peer banks, regulations, and dynamic risk intelligence.
Acin Platform tour
Digitise, diagnose and assure your operational risk controls in a connected data network across your firm and industry.
- Connect your front to back risk controls into the network
- Calibrate key control description fields to the Acin Network Index and see how you compare to your peers.
- Quantify the design of your risk controls. Score, compare and track your control design with the Acin Score.
- Identify opportunities to improve completeness using diagnostics.
- Report on missing, proliferated or imprecise controls by business, risk or filter by regulation.

 Network
See how your risks and controls compare with your peers
The network comprises of the industry’s highest quality data from many of the Global Systemically Important Banks (G-SIB), Investment & Retail Banks, and Asset Managers.
This consists of 36,000 unique risk controls, 214,000 clause level regulations mapped to index controls, and 3.7m data points. The network tells you which controls are in use by percentage of all member banks by business line, region, regulation etc. which allows you to analyze areas of weakness, assess your gaps and remediate them fast with Golden Control index definitions.
Data
Standardize, quantify and map your risk controls
Data from each bank is processed via our AI engine, checked by SME’s – and improved with the client where needed – to conform to the de facto industry standard. Acin’s Data Technical Standard (DTS 2.0) further clarifies best practice for risk and control description fields.
Standardised data can now be reconciled and mapped to Acin network index controls. Your own structured data is now quantifiable, against which you can develop AI, deeply analyze, use for modelling RWA reductions, and reporting to regulators.
Diagnostics
Understand where you stand
Reporting and analysis in-platform is powerful, enabling views by risk, theme, regulation, business unit, asset class, product etc. filtered by missing controls, duplicates, proliferation, at-risk, undocumented etc. Our practitioner teams work with you to interpret data, create specific management reporting for 1/2/3LoD and the Board as well as answer regulatory exam questions.
Clients use platform data for Group Risk Matrix modelling, input to analytics systems, as well as monitoring alerts and scenarios as dynamic RCSA triggers.
 Risk intelligence
Connect to the risk controls data network
Deeply embed risk awareness into the operating model across the firm. Horizon scanning alerts trigger dynamic, proactive risk and control assessments. Mapped to peer data, this delivers powerful actionable insights for more sophisticated risk management.
Enabling firms to calibrate their risk controls

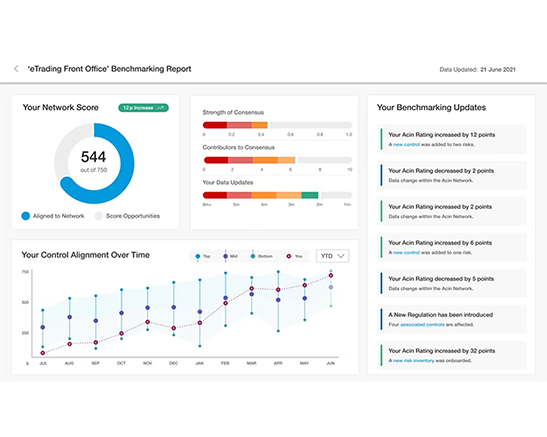
Demonstrate completeness
Calibrate to the consensus and know where you stand versus the consensus and your peers.
Respond to stakeholder challenge
Use objective fact-based analysis in stakeholder conversations to partner effectively.
Maintain effectiveness and efficiency
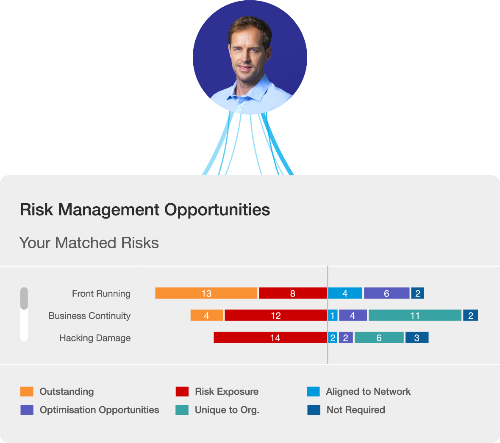
Remove siloed data and proliferation with one consistent language driven by data.Identify emerging risk
Act on industry intelligence, horizon scanning, and alerts. Move from detect and correct to predict and prevent.
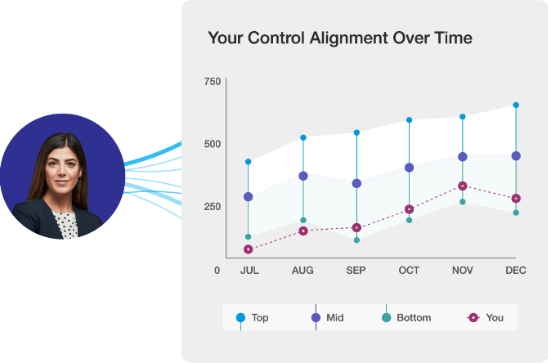
Track your operational resilience
Demonstrate changes to your risk controls vs peers over time and move towards dynamic RCSAs.