

Insight
3 mins reading time
Is banking getting safer despite rising OpRisk?
Before diving into a couple of insights, which are already resonating strongly with network members, I’d like to set the scene. Firstly, our current Investment Banking (IB) network comprises F2B data from all asset classes across the Front Office, Operations, Finance, Product Control, Technology, Compliance, Risk, Legal and HR – that’s 4,400 risks linked to 22,000 controls. Secondly, after removing FO duplicate controls, the support functions have on average 3x more controls, the bulk of which reside in Operations and Technology.
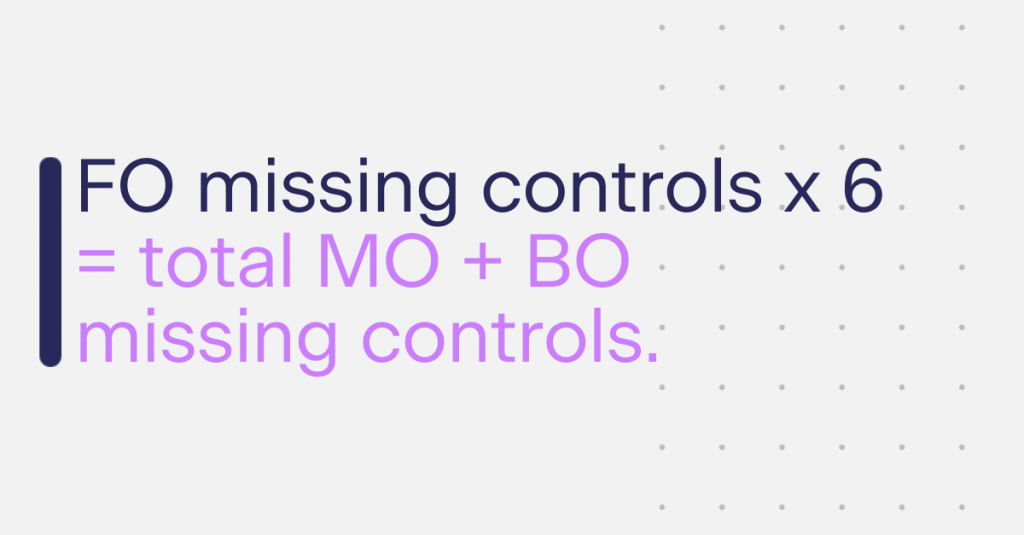
To manage the risk in a business, F2B visibility is essential, and whilst the risk resides in the front line, the support function controls need to align clearly and cleanly. The network tells us the number of missing controls here is 352 across F2B peers. Despite the comparative 3x size difference, this is 6x the number of missing controls we saw last year across the FO.
Following the review process with client Subject Matter Experts (SME’s) for new or refreshed data, some unclear controls are usually clarified and excluded, often raising the missing control tally . Operations accounts for half of all those preliminary missing (93 on average), followed by Technology & Product Control.
So, while this is all very interesting, and valuable in the medium term – because you have a list of confirmed missing controls, being used by peers – your problems may well be more immediate and revolve around remediation projects and limited resources. Even so, you’re now able to utilize the network to set priorities.
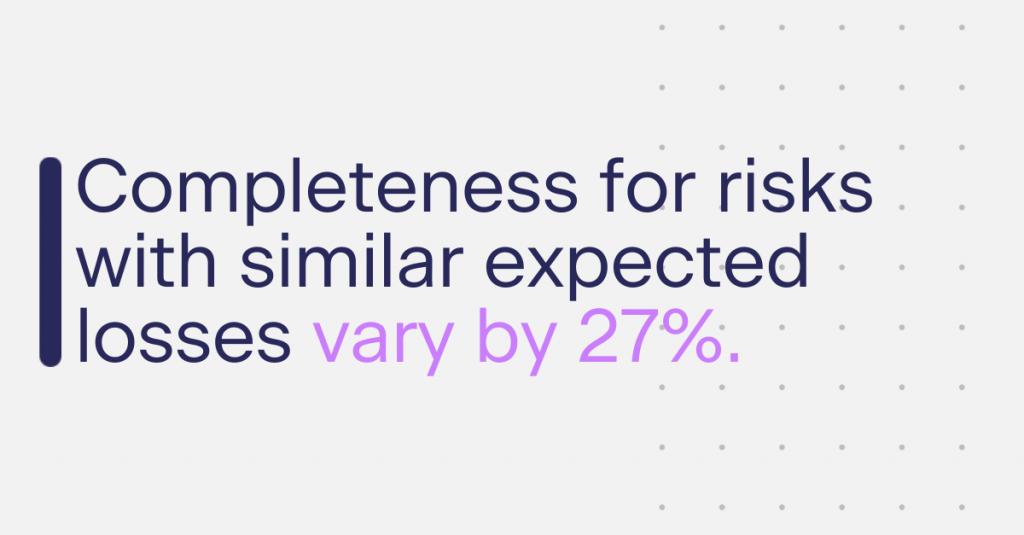
For any firm’s top risks, one would expect a consistent level of quality and completeness in the control environment, between a) risks with similar loss potential, and b) across the teams delivering those control environments.
However, the network reveals up to a 27% variance in F2B control completeness scores for different risks with similar levels of expected losses (a quick explanation of the network score is that it’s a number between 0 and 750, measuring the frequency and strength of each risk control when compared to the network consensus). And there exists a 16% variation in control completeness across various FO and support functions delivering controls to that same risk. So, if you don’t already, you may well be asking “Do we know where our weakest links are, and where should we start to look?”.
Being able to identify risks with the highest levels of residual exposure – and variance to peer best practice – should give you some direction around what to strengthen first. And knowing these levels of inconsistency probably exist within your firm, why wouldn’t you quickly pinpoint where your weakest links are, in terms of existing control design and potential gaps.
Sticking with top risks, and looking at the hot topics of Compliance (incl. Market Abuse, Fair Outcomes for Clients, Data Management) and Financial Crime (Sanctions, Rogue Trading).
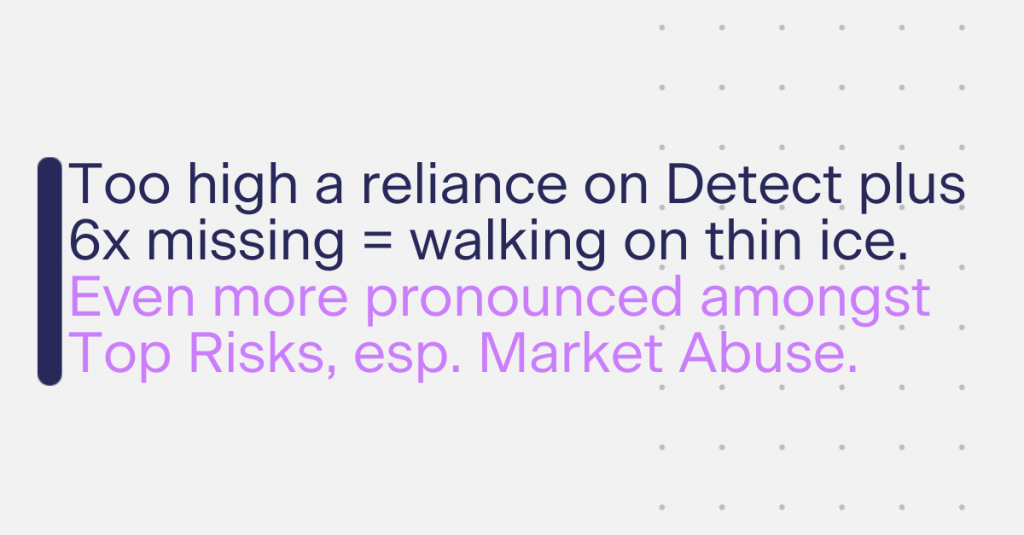
What jumps out is the under reliance on Prevent controls in the FO, which will have negative consequence on the probability of a particular risk occurring. The network consensus across all risk stripes indicates a 1 in 3 ratio of Prevent to Detect controls in the FO is possible, whereas most firms are operating at no better than a 1 in 4 ratio for their top risks. This results in a much higher reliance on Detect controls in the support function, further exacerbated by the higher levels of missing controls that we observe.
This problem is certainly more pronounced in these areas of top risk, and Market Abuse specifically. And we’re not seeing high enough rates of change in the data to compensate this with a more complete set of Detect controls Front to Back, which will help mitigate the severity of risk events that do actually crystallize.
On a brighter note, average completeness scores across these areas is within 3% (349-363) of each other, meaning there are higher levels of completeness and consistency between firms.
In short, network members are able to identify areas of weaker risk, when compared internally, or to those of their peers, then analyze their Prevent controls – indicating how they might reduce the likelihood of risks occurring through a more complete control environment – and/or reduce the severity through stronger Detect controls.
In March this year, Acin finished adding 4,600 support function risk controls to the existing Front Office (FO) network, comprising 12 global banks. Including 10,000 regulation-to-control tags , the total number of connected data points now exceeds 102,000.
Member banks are able to compare all their controls (F2B for Global Markets) with their peers. They can see the relative strengths between top risks, where priority themes are weaker, missed regulation, which control gaps exist, and specifically what best practice definitions actually look like – all of which is being used to support, validate and speed up critical remediation work.
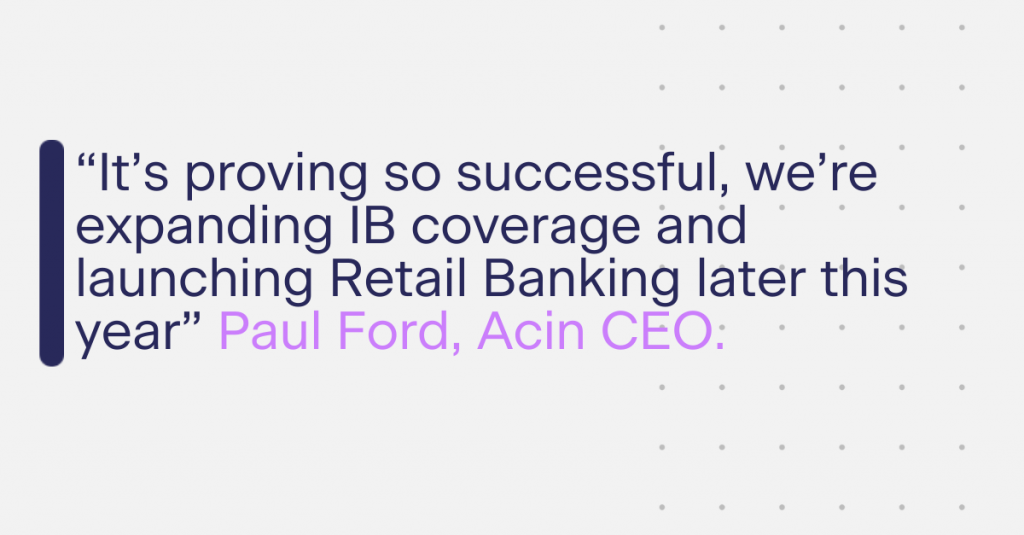
“It’s proving so successful, we’re expanding IB coverage and launching Retail Banking later this year” said Paul Ford, CEO.
Insight, fast decision making, and subsequent improvements to speed and quality are being driven by clear visibility of control level consensus between banks, across all areas. Using the signal strength of common risk controls allows each bank to make decisions about what they’re missing, and how to strengthen what’s already there based on best practice that other banks in the network have to offer. It’s win-win for everybody.
Network members are able to reduce residual risk, and move themselves into higher industry quartiles, because they are making more objective OpRisk decisions. And as similar practice across market and credit risk already tells us, you’re only able to do this based on clean data, contributed by the market.
If you’re interested in how all this works to further reduce residual risk, or remediate faster, please reach out to our practitioner teams in the US or Europe.